Info
Data

It is difficult to understand the systemic and complex nature of climate change because human activity affects several ecosystems, which in turn affect others. This visualization represents some of the most important interdependencies between species through the use of visual analogies and a 3D space that can be compared with two overlapping layers.

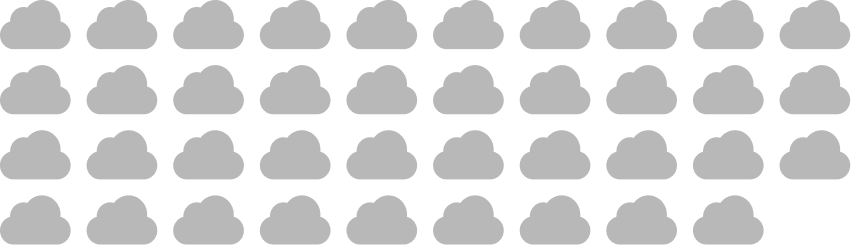
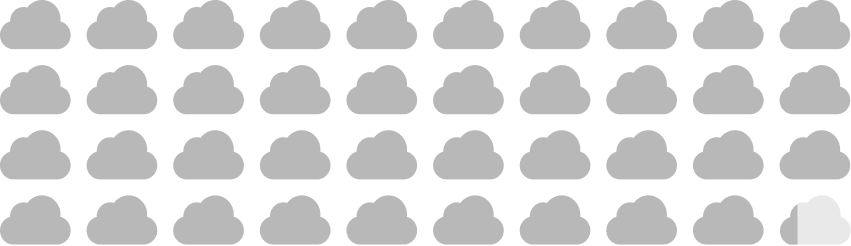
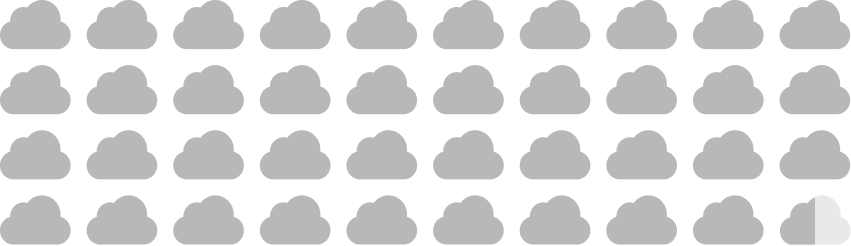
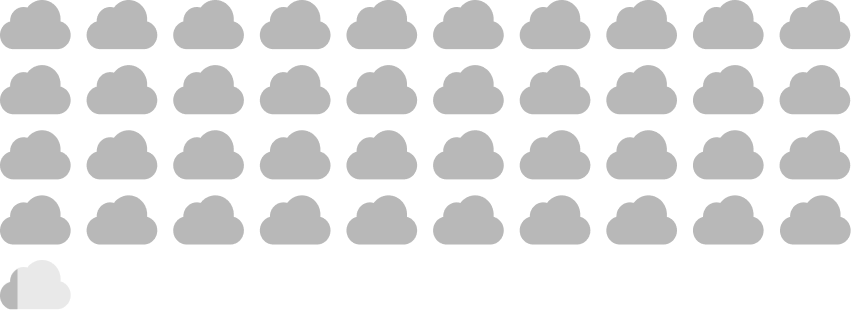
The atmosphere layer has been broken down to represent the exceedance of the CO2 level beyond which, according to IPCC Report, human civilization as we know it will change.

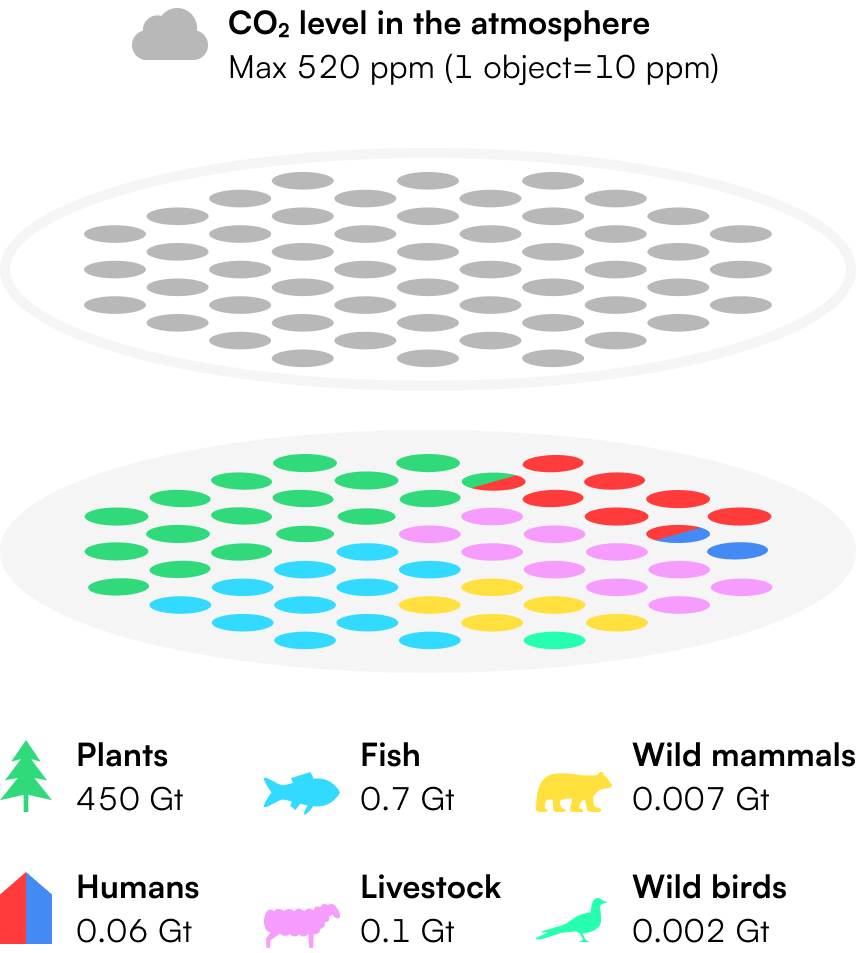
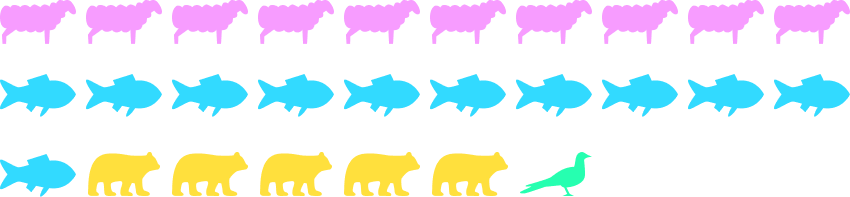
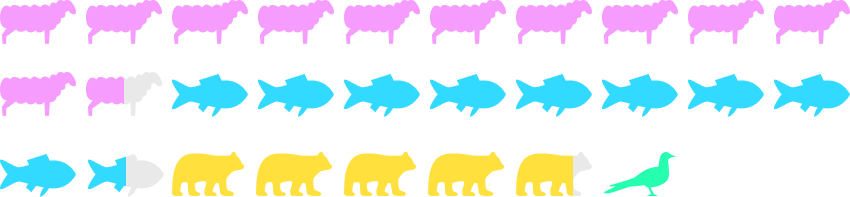
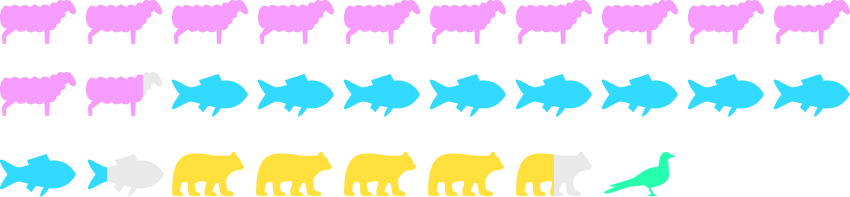
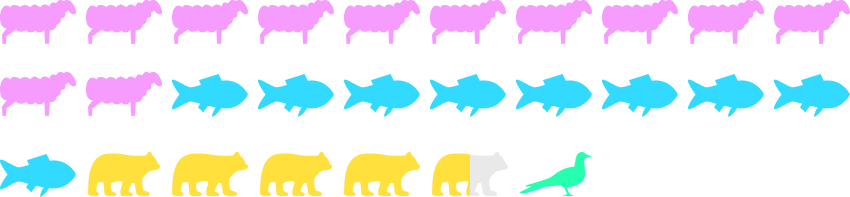
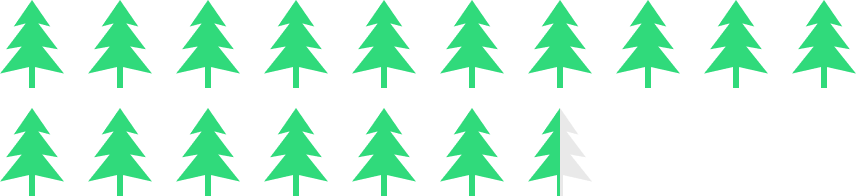
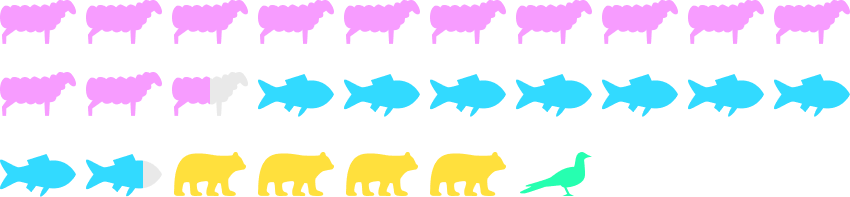
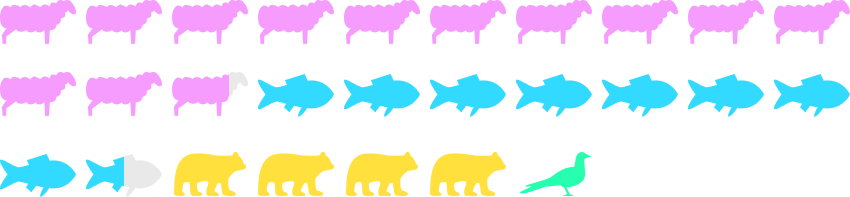
The land layer was subdivided based on estimated biomass for plants and other species. The breakdown was done with a logarithmic scale in order to make possible comparisons between large and very small categories.

2010
Atmosphere layer
CO2 level in the atmosphere
390.01 ppm
Land layer
Human population
6,985,603,105
Electricity produced by Non-renewable energy
79.9%
Electricity produced by Renewable energy
19.4%
Land covered by trees
31.52%
Biodiversity
35.15% (1970=100%)
2011
Atmosphere layer
CO2 level in the atmosphere
391.85 ppm
Land layer
Human population
7,073,125,425
Electricity produced by Non-renewable energy
79.61%
Electricity produced by Renewable energy
19.8%
Land covered by trees
31.49%
Biodiversity
33.44% (1970=100%)
2012
Atmosphere layer
CO2 level in the atmosphere
394.06 ppm
Land layer
Human population
7.161,697,921
Electricity produced by Non-renewable energy
78.73%
Electricity produced by Renewable energy
20.6%
Land covered by trees
31.45%
Biodiversity
32.37% (1970=100%)
2013
Atmosphere layer
CO2 level in the atmosphere
396.74 ppm
Land layer
Human population
7,250,593,370
Electricity produced by Non-renewable energy
77.92%
Electricity produced by Renewable energy
21.5%
Land covered by trees
31.42%
Biodiversity
31.74% (1970=100%)
2014
Atmosphere layer
CO2 level in the atmosphere
398.81 ppm
Land layer
Human population
7,339,013,419
Electricity produced by Non-renewable energy
77.37%
Electricity produced by Renewable energy
22%
Land covered by trees
31.38%
Biodiversity
31.67% (1970=100%)
2015
Atmosphere layer
CO2 level in the atmosphere
401.01 ppm
Land layer
Human population
7,426,597,537
Electricity produced by Non-renewable energy
76.6%
Electricity produced by Renewable energy
22.7%
Land covered by trees
31.34%
Biodiversity
31.63% (1970=100%)
2016
Atmosphere layer
CO2 level in the atmosphere
404.41 ppm
Land layer
Human population
7,513,474,238
Electricity produced by Non-renewable energy
75.59%
Electricity produced by Renewable energy
23.5%
Land covered by trees
31.31%
Biodiversity
31.15% (1970=100%)
2017
Atmosphere layer
CO2 level in the atmosphere
406.76 ppm
Land layer
Human population
7,599,822,404
Electricity produced by Non-renewable energy
74.78%
Electricity produced by Renewable energy
24.4%
Land covered by trees
31.27%
Biodiversity
30.89% (1970=100%)
2018
Atmosphere layer
CO2 level in the atmosphere
408.72 ppm
Land layer
Human population
7,683,789,828
Electricity produced by Non-renewable energy
74.22%
Electricity produced by Renewable energy
25%
Land covered by trees
31.23%
Biodiversity
30.90% (1970=100%)
2019
Atmosphere layer
CO2 level in the atmosphere
411.66 ppm
Land layer
Human population
7,764,951,032
Electricity produced by Non-renewable energy
73.14%
Electricity produced by Renewable energy
26%
Land covered by trees
31.19%
Biodiversity
30.90% (2018=last data available)
2020
Atmosphere layer
CO2 level in the atmosphere
416 ppm
Land layer
Human population
7,840,952,880
Electricity produced by Non-renewable energy
71.32%
Electricity produced by Renewable energy
27.9%
Land covered by trees
31.16%
Biodiversity
30.90% (2018=last data available)
Top view
3/4 view
View in AR
View in AR
Credits
Wait a few seconds until the model is loaded.
Rotate your device to experience the website.